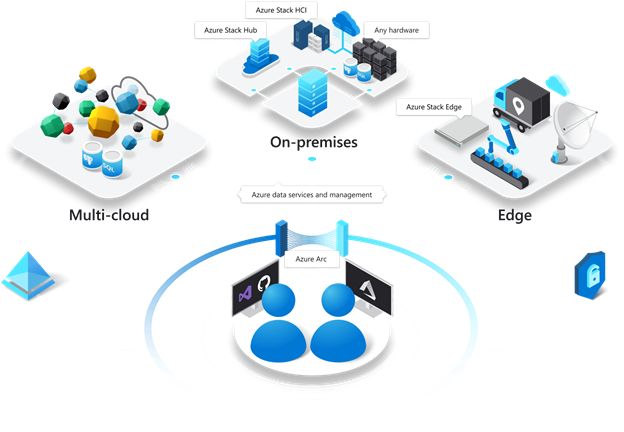
Cloud and Datacenter Management Blog

Microsoft Hybrid Cloud blogsite about Management


Leave a comment

Adding Windows Server 20H2 Core to Azure Arc Services with #WindowsAdminCenter #Winserv #Azure

Azure Arc Services

Azure Arc enabled servers allows you to manage your Windows and Linux machines hosted outside of Azure, on your On-premises network, or other cloud provider consistent with how you manage native Azure virtual machines. When a hybrid machine is connected to Azure, it becomes a connected machine and is treated as a resource in Azure. Each connected machine has a Resource ID, is included in a resource group, and benefits from standard Azure constructs such as Azure Policy and applying tags. Service providers who manage a customer’s on-premises infrastructure can manage their hybrid machines, just like they do today with native Azure resources, across multiple customer environments, using Azure Lighthouse with Azure Arc.

To deliver this experience with your hybrid machines hosted outside of Azure, the Azure Connected Machine agent needs to be installed on each machine that you plan on connecting to Azure. This agent does not deliver any other functionality, and it doesn’t replace the Azure Log Analytics agent. The Log Analytics agent for Windows and Linux is required when you want to proactively monitor the OS and workloads running on the machine, manage it using Automation runbooks or solutions like Update Management, or use other Azure services like Azure Security Center.

In earlier blogpost I wrote about Windows Admin Center and the Installation of Windows Server 20H2 Core version.

Now we have my Dark20H2.MVPLAB.LOCAL Windows Server Core managed by Windows Admin Center, I like to connect the Windows Server 20H2 Core to Azure Arc Services for Hybrid IT Management to get the benefits of the Cloud.

In the next step-by step guide we will enable Azure Arc Services by installing the agent on the Windows Server 20H2 Core.

Prerequisites

  • If you don’t have an Azure subscription, create a free account before you begin.
  • Deploying the Arc enabled servers Hybrid Connected Machine agent requires that you have administrator permissions on the machine to install and configure the agent. On Linux, by using the root account, and on Windows, with an account that is a member of the Local Administrators group.
  • Before you get started, be sure to review the agent prerequisites and verify the following:
    • Your target machine is running a supported operating system.
    • Your account is granted assignment to the required Azure roles.
    • If the machine connects through a firewall or proxy server to communicate over the Internet, make sure the URLs listed are not blocked.
    • Azure Arc enabled servers supports only the regions specified here.

Open Azure Arc in the Portal.

Because I have already Azure Arc Active for my Azure Stack HCI Cluster in my MVPLAB.LOCAL, I will click on Servers on the left.

Click on Add

We will Generate a Script for the Single Windows Server 20H2 Core.
You can Add also Servers at Scale.

HTTPS Access to Azure Services is Needed
and
Local Administrator permissions, Click Next

Select the right Azure Subscription and the Resource Group.
Select the Azure Region and Operating System.
and the URL when you are behind a Proxy Server.
Click Next.

You can add Tags for Administrative tasks like Costs.
Click Next.

Here you can Copy and Paste the Script or Download it.
I downloaded the PowerShell Script.
Click on Close.

Windows Admin Center in action on Windows Server 20H2 Core

The Windows Server Dark20H2.mvplab.local is a basic installation and managed by Windows Admin Center

Now we have to do the following steps :

  1. Copy the Azure Arc PowerShell Script to the Server with WAC.
  2. Install Azure PowerShell on the Server
  3. Run the Azure Arc PowerShell Script.

1. Copy the Azure Arc PowerShell Script to the Server with WAC

First we use Windows Admin Center to make a directory on the Server for uploading the Azure Arc PowerShell Script.

I have made a Azure Arc directory with Windows Admin Center.
Click on Upload.

Browse to your Azure Arc PowerShell Script.

Click on Submit.

The Azure Arc PowerShell Script is now on the Server.

2. Install Azure PowerShell on the Server

In the following steps we will install Microsoft Azure PowerShell on the Server via Windows Admin Center.

Type: $PSVersionTable.PSVersion
You need at least PowerShell 5.1

  1. Install .NET Framework 4.7.2 or later.
  2. Make sure you have the latest version of PowerShellGet. Run Install-Module -Name PowerShellGet -Force

Run the following script :

———————————————————————-

if ($PSVersionTable.PSEdition -eq ‘Desktop’ -and (Get-Module -Name AzureRM -ListAvailable)) {
Write-Warning -Message (‘Az module not installed. Having both the AzureRM and ‘ +
‘Az modules installed at the same time is not supported.’)
} else {
Install-Module -Name Az -AllowClobber -Scope CurrentUser
}

———————————————————————–

Type Y or A ( Yes or Yes to All)

Installing the Azure PowerShell Modules.

Now we are ready for the Azure Arc PowerShell Script.

3. Run Azure Arc PowerShell Script on the Server.

From here we are going to install the Microsoft Azure Arc PowerShell Script to join this server to Azure Arc Services with an Agent.

Run   .\OnboardingScript (1).ps1
It will ask for a Device login to Azure with a Code.
I did that on the Windows Admin Center Server.

When you Login to Azure with your Account you will see this Screen.

The Next screen is the completion in Windows Admin Center PowerShell of the Windows Server 20H2 Core.

This Dark20H2.mvplab.local Server is now connected with Azure Arc Services.
Azure Arc Enabled Server.

Here we see the Windows Server 202H2 Core in Azure Arc.

Azure Arc Services

Installing Azure Arc Insights

Here we start with one of the Azure Arc Services on the On-Premises Windows Server 20H2 Core called Azure Arc Insights.

Click on Insights on the Left of the Azure Arc Server.
Click on Enable.

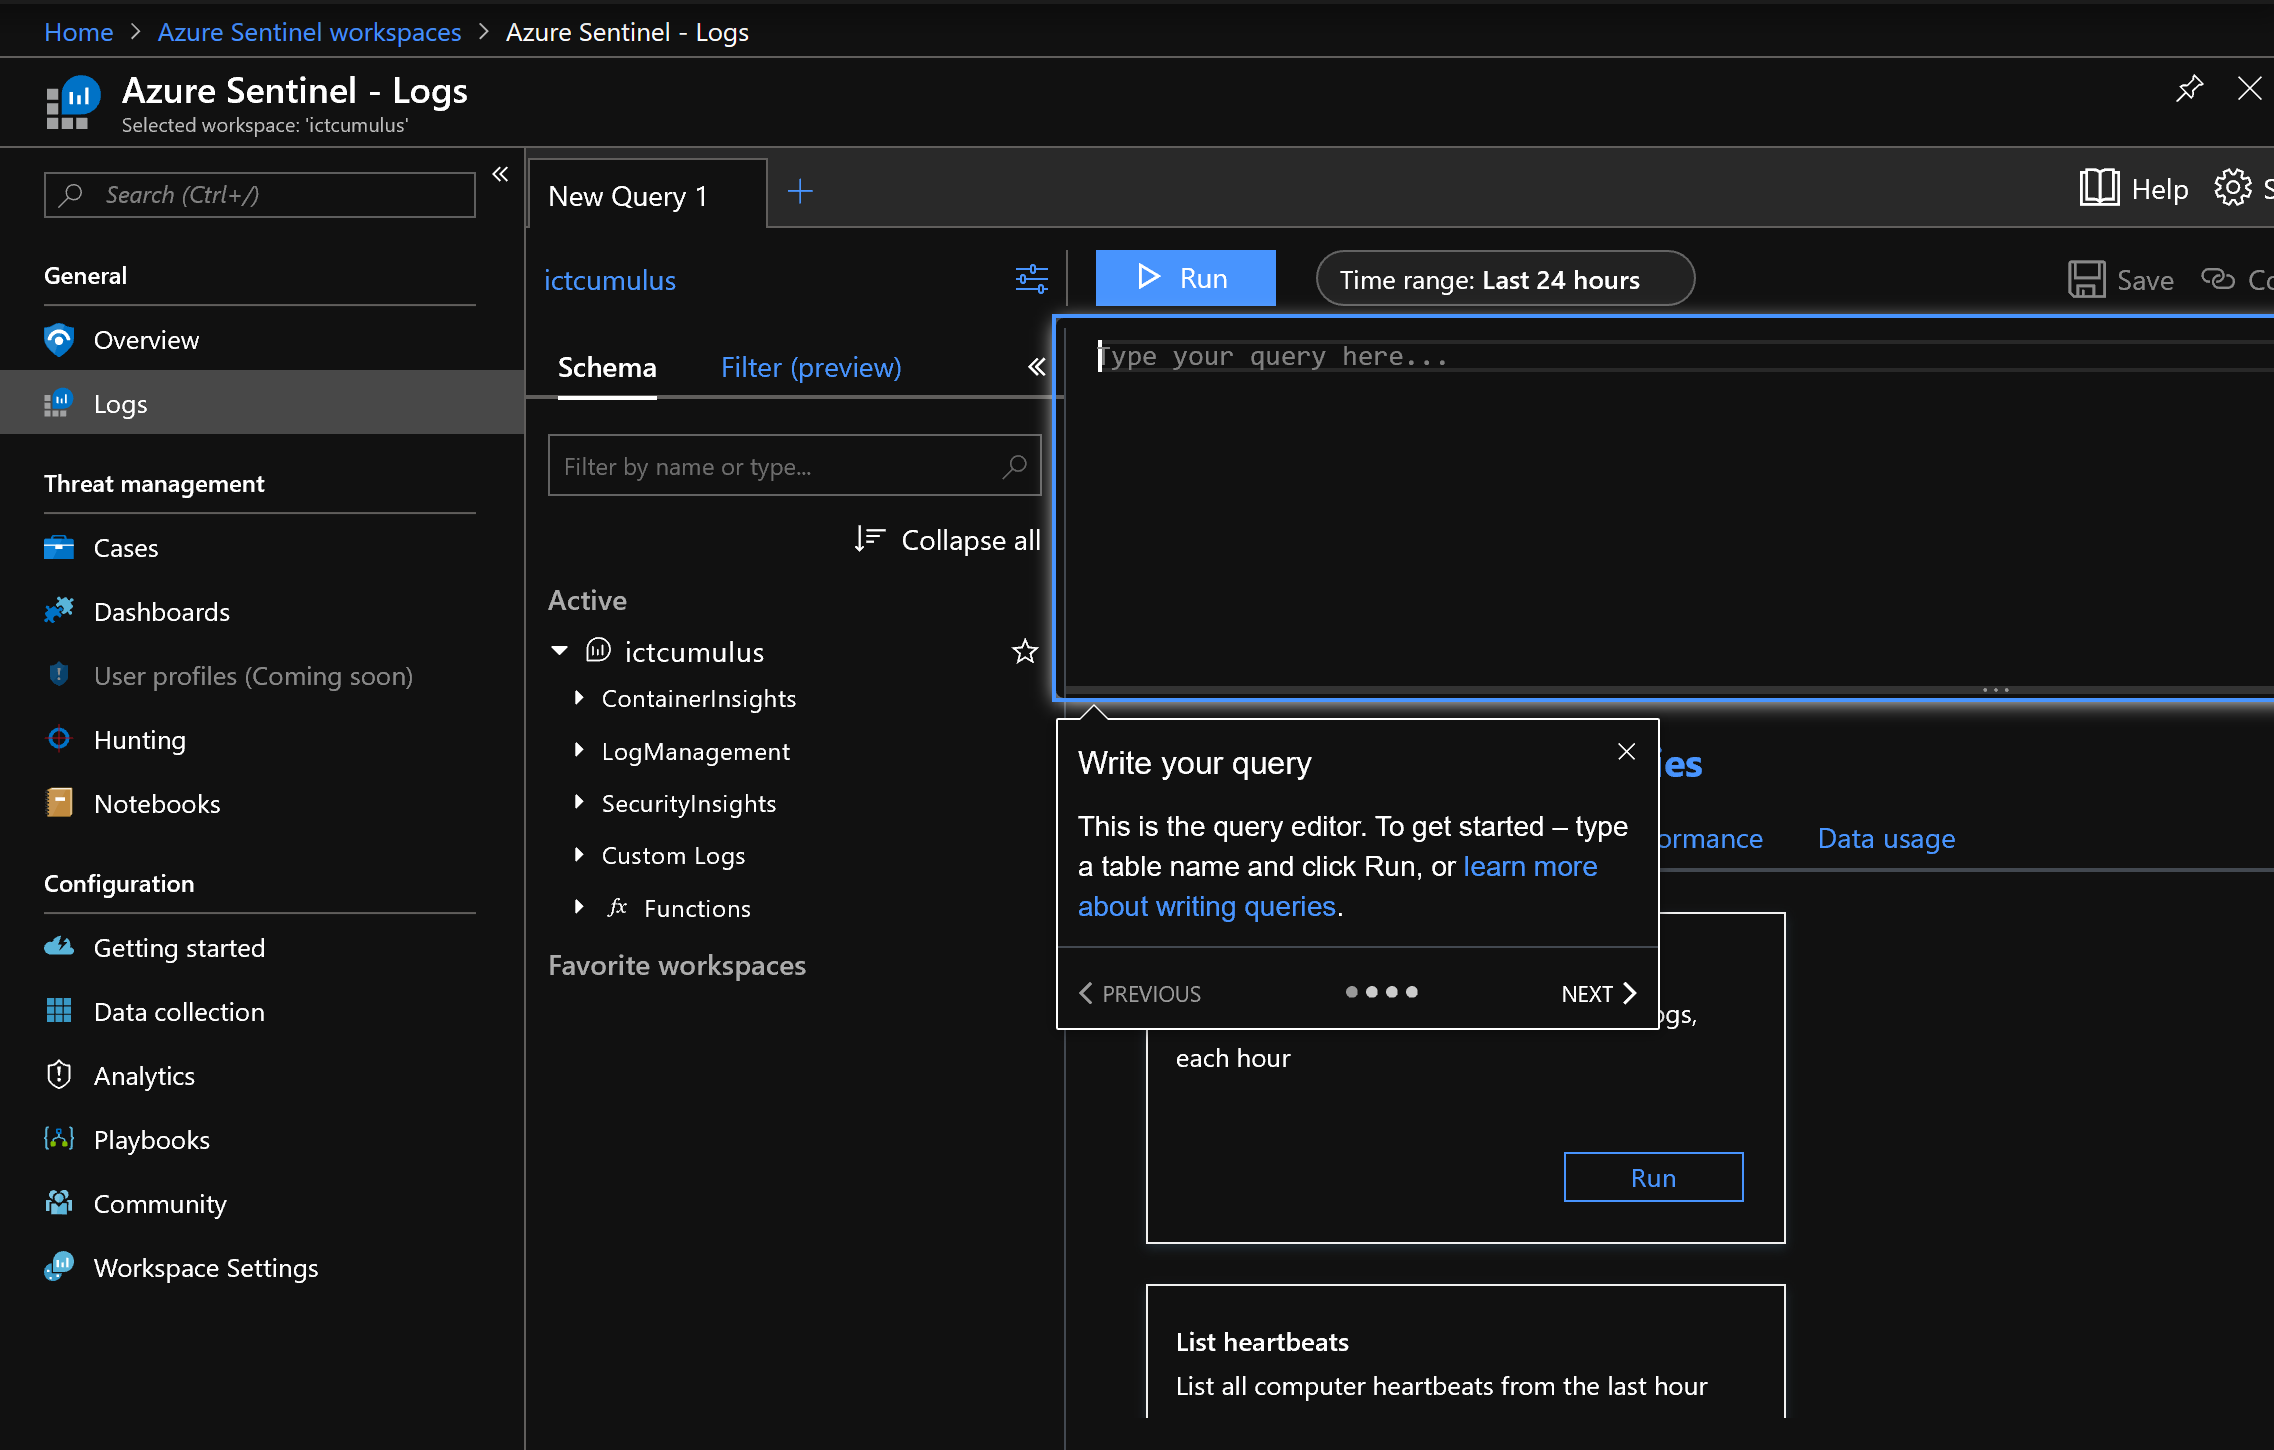
Select your Azure Subscription and Log Analytics Workspace.
Click on Enable.

Installation of Azure Arc Insights in progress……

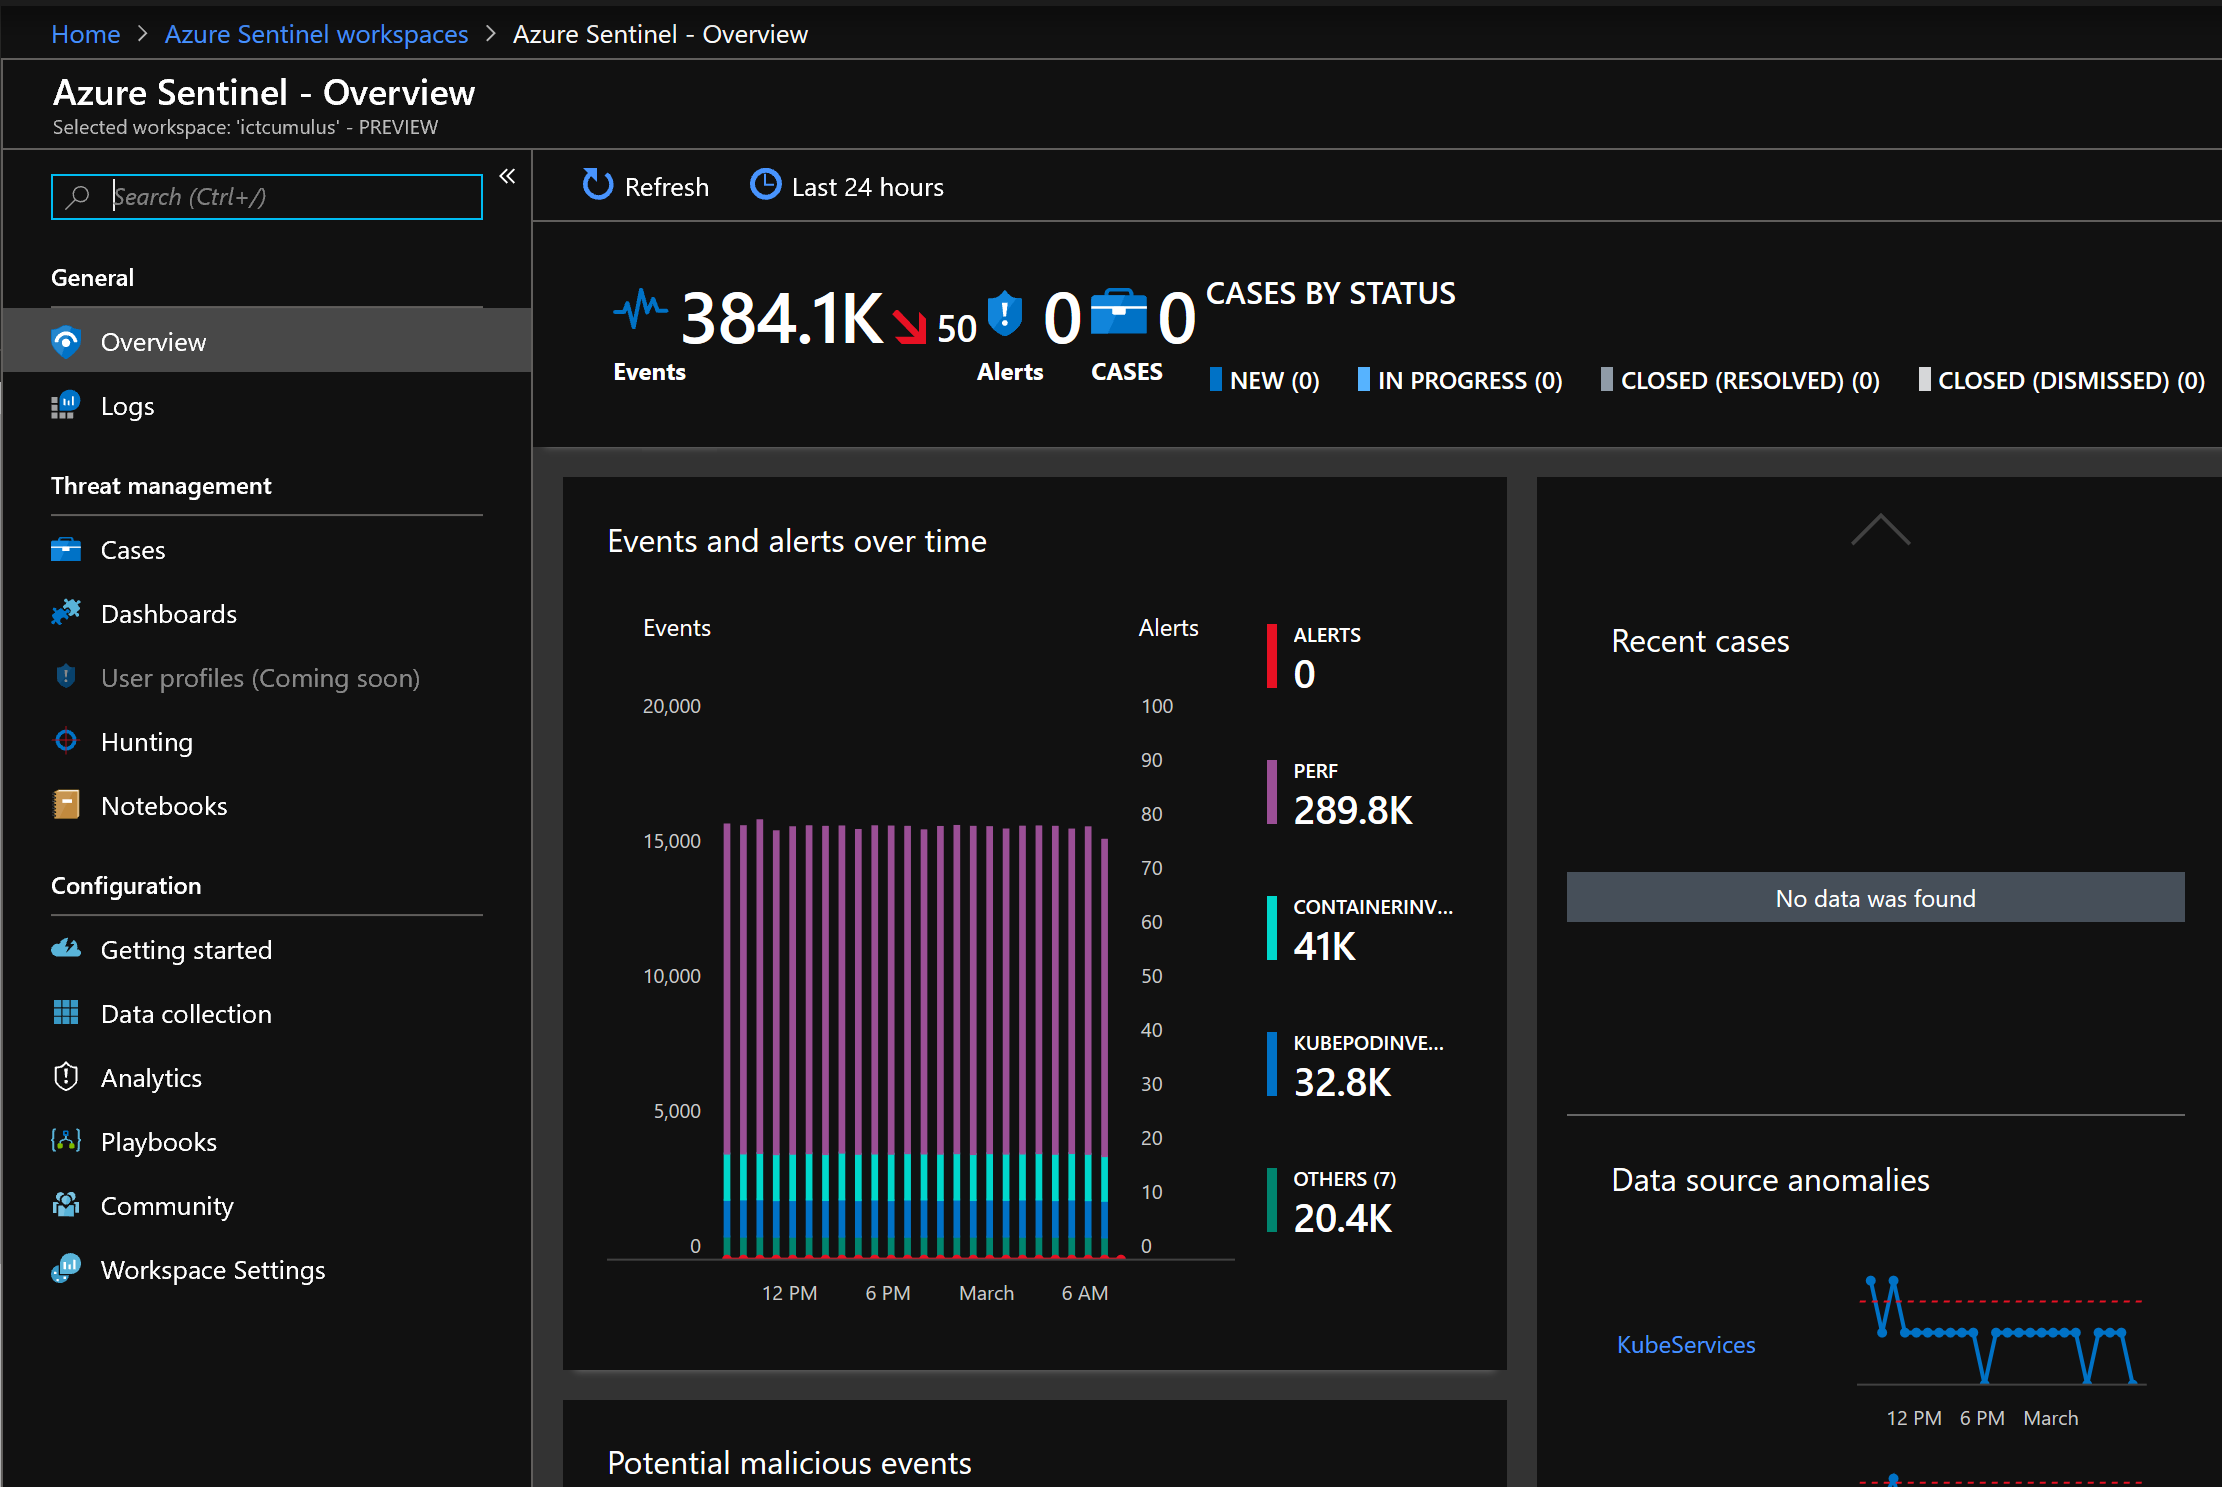
It’s Ready and waiting for data in Azure.

Performance View of On-Prem Servers.

Azure Arc Service Map will come available

Conclusion

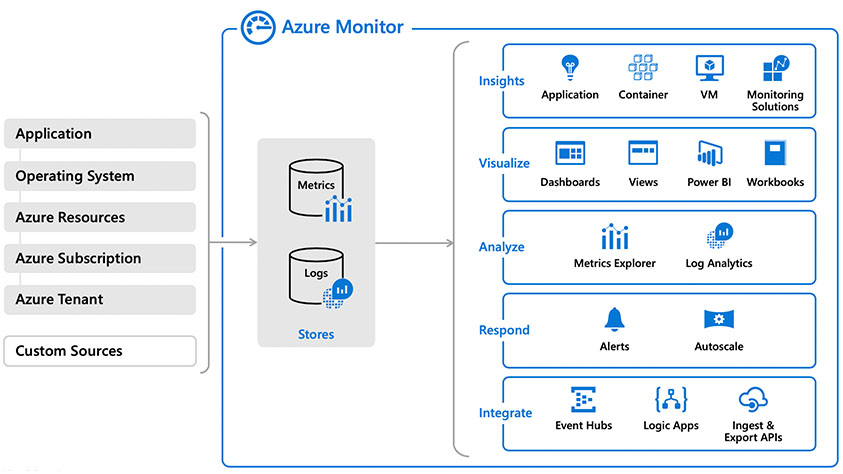
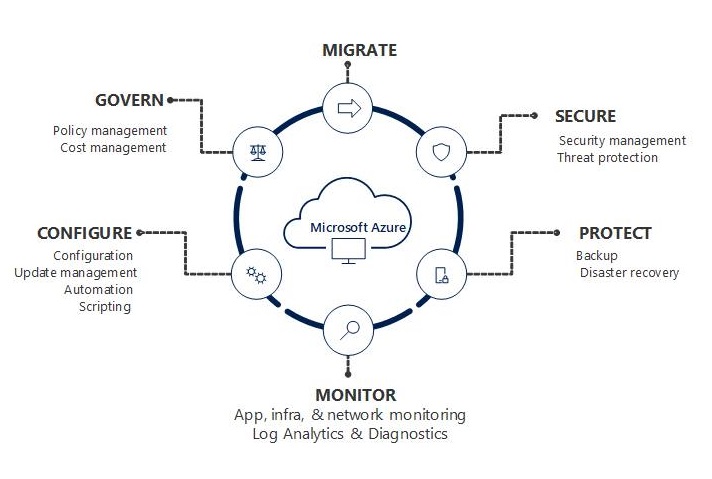
With Microsoft Azure Arc Services you get the Azure Cloud Management services connected with On-Premises Servers. You get Azure Security Center, Log Analytics, Azure Monitoring and Alerting, Update Management, Change tracking and Automation tasks. This is the power of Hybrid IT Management and get the best of Tools there is like Windows Admin Center supporting me with Windows Server 20H2 Core. Azure Arc Services with Kubernetes and Azure Stack HCI Management is powerful and with a Single pain of Glass in IT Management. Hope this helpful for you, and Go for it yourself. 😉


Leave a comment

Microsoft Azure Monitor Overview #Cloud #Analytics #Hybrid #AzOps #Azure

Microsoft Azure Monitor

Monitor, diagnose, and gain insight into the performance and availability of your applications and services with Azure Monitor. In this video, you’ll learn how to use Azure Monitor to collect, analyze and act on telemetry from your cloud and on-premises environments.

Learn how to create time series charts of platform and resource metrics for visualization and analysis with Azure Monitor. Start in Azure Monitor to view metrics across multiple resources or start directly from individual resource blades. You will also learn how to add metrics charts to dashboards in the Azure portal for real-time monitoring and shared access across teams.

In this video, learn about action rules and how you can use them to configure actions and notifications for multiple alerts at scale across a subscription, resource group, and target resource.

In this video, learn how alerts enable you to proactively identify and address issues before it impacts the users of your system. Alerts are created on performance and availability data and can be associated with user-defined actions and notification mechanisms.

In this video, learn how to use source map support in Azure Monitor Application Insights to improve the diagnosis of client-side JavaScript errors. Source maps can be used to unminify call stacks found on the Application Insights end to end transaction details page.

Here you find more information about Microsoft Azure Monitor:


Microsoft Azure Monitor Documentation 


Get Started with Microsoft Azure Monitor

Follow Azure Monitor on Twitter 

Microsoft Azure Monitor & Security for Hybrid IT Community Group on LinkedIn

Keep in control of IT with Microsoft Azure Monitor


Leave a comment

Upgrading and Monitoring Azure AKS Kubernetes Cluster #Azure #AKS #ContainerInsights

Microsoft Azure AKS Kubernetes Cluster

Azure Kubernetes Service (AKS) makes it simple to deploy a managed Kubernetes cluster in Azure. AKS reduces the complexity and operational overhead of managing Kubernetes by offloading much of that responsibility to Azure. As a hosted Kubernetes service, Azure handles critical tasks like health monitoring and maintenance for you. The Kubernetes masters are managed by Azure. You only manage and maintain the agent nodes.

Azure AKS Kubernetes Services in Resource Group.

When you go to settings of your Azure AKS Kubernetes Cluster and then to Upgrade, there you can see your version of Kubernetes and the New versions of Azure AKS Services. Before you upgrade :

  • Important : Never skip an Upgrade version of Azure AKS Kubernetes.

Here you find all the information about Azure AKS Kubernetes Change Log on GitHub 

You can Upgrade from here by clicking on version 1.15.5 and click on Save at the top.

Azure Activity log.

When the first upgrade is succeeded you can do the next version upgrade.

With Azure Monitoring Insights you can view the live data and see what’s going on.

Azure Monitoring Container Insights.

When the upgrade is completed, you want to see if your new Azure AKS Cluster Services is Healthy.
This Health (Preview) feature is handy to see if all Services are running good.


Azure Monitoring Insights Health of the AKS Kubernetes Services.

The Upgrades are of course also possible via Microsoft Azure Cloud Shell with Azure CLI

Azure CloudShell

To Upgrade your AKS Services via Microsoft Azure CLI

As a DevOps person you like to work with Microsoft Visual Studio Code
Deploying and managing your Azure AKS Kubernetes Cluster services from there with the right extensions.

Here you see also that the KubeProxyVersion is v1.15.7

The extension for developers building applications to run in Kubernetes clusters and for DevOps staff troubleshooting Kubernetes applications.

Features include:

  • View your clusters in an explorer tree view, and drill into workloads, services, pods and nodes.
  • Browse Helm repos and install charts into your Kubernetes cluster.
  • Intellisense for Kubernetes resources and Helm charts and templates.
  • Edit Kubernetes resource manifests and apply them to your cluster.
  • Build and run containers in your cluster from Dockerfiles in your project.
  • View diffs of a resource’s current state against the resource manifest in your Git repo
  • Easily check out the Git commit corresponding to a deployed application.
  • Run commands or start a shell within your application’s pods.
  • Get or follow logs and events from your clusters.
  • Forward local ports to your application’s pods.
  • Create Helm charts using scaffolding and snippets.
  • Bootstrap applications using Draft, and rapidly deploy and debug them to speed up the development loop.

Upgrade Azure AKS Kubernetes Services is Done 😉

When you manage and monitor your Azure AKS Kubernetes Cluster Services, have also a look at Microsoft Azure Advisor for new features and security issues :

Azure Advisor recommendations for Kubernetes services.

The cool thing is that Microsoft also give you the solution to solve a high risk :


Remediation steps.

Conclusion :

Microsoft Azure AKS Kubernetes is a managed services and made upgrading for customers really easy to do. You can monitor the upgrades and see the Health status of the Azure AKS Kubernetes services. You get free advise to improve the Services and this all keeps you in control and your business running.


Leave a comment

Don’t miss this Awesome #Microsoft Ignite 2019 Event of the Year #MSIgnite

Microsoft Ignite 2019

LEARN | CONNECT | EXPLORE

You don’t want to miss this Awesome Microsoft Ignite 2019 Event of the Year in Orlando, Florida !
If you can’t attend, don’t worry you can follow the Live Stream of MS Ignite here
Or here on Microsoft Ignite YouTube Channel

Have a look at the Microsoft Ignite 2019 Agenda

Plan your sessions for Microsoft Ignite 2019 ( More 1000+)

Download the Microsoft Events Mobile App for MS Ignite 2019 here

Follow @MS_Ignite on Twitter here

Use #MSIgnite on Social media

JOIN the Community on LinkedIn

JOIN Azure DevOps Community

linkedin.com/groups/1213925

JOIN Containers in the Cloud Community

linkedin.com/groups/1353996

JOIN Azure Monitor and Security Community

linkedin.com/groups/1351711


Leave a comment

What is Microsoft Azure Sentinel? #SIEM #AI #Analytics #Azure #Security #ContainerInsights

Building on the full range of existing Azure services, Azure Sentinel natively incorporates proven foundations, like Log Analytics, and Logic Apps. Azure Sentinel enriches your investigation and detection with AI, and provides Microsoft’s threat intelligence stream and enables you to bring your own threat intelligence.

Microsoft Azure Sentinel is a scalable, cloud-native, security information event management (SIEM) and security orchestration automated response (SOAR) solution. Azure Sentinel delivers intelligent security analytics and threat intelligence across the enterprise, providing a single solution for alert detection, threat visibility, proactive hunting, and threat response. Read more about Azure Sentinel Preview here

Run a Log Analytics query from Azure Sentinel and use Bookmarks to Hunt

Configure your own Data-Connector to Azure Sentinel Workspace

Read here more about Connecting data sources

Happy Hunting


Leave a comment

#Microsoft Azure Central Monitoring for your Team #Dashboards #Azure #ContainerInsights #Apps

Full Screen Monitoring

When you install Azure Virtual Machines or Kubernetes Clusters in the Microsoft Cloud, It’s important to monitor your workload and keep your IT department in Control for the Business. Metric alerts in Azure Monitor work on top of multi-dimensional metrics. These metrics could be platform metrics, custom metrics, popular logs from Azure Monitor converted to metrics and Application Insights metrics.

When you have important alerts, you want to take action based on your rules.

Take action on Alerts

Make your Own rules based on Alerts.

IT Department of a company has most of the time different teams with each having it’s own responsibility of workloads in the Microsoft Cloud. For example, the Servicedesk is supporting the Business and they like to see if all the Services are up and running for the Business. The Infrastructure Team wants the same, but on deep level components of the Services like Memory, Network, Storage, CPU, Performance, Availability and more. The Technical Application Team is interested if the application is running and working with all the Interfaces, Databases, and/or Azure Pipelines.

Each Team can build there own Azure Dashboard(s) in the Microsoft Cloud.

Here I Have made an easy example of my Windows Server 2019 Virtual Machines and my Azure Kubernetes Cluster in One Microsoft Azure Dashboard :

You can Start from Azure Monitor Metrics

Or you can Start from the Virtual Machine Blade here.

When you have your Azure Monitor metrics ready with the right information then you can create it in your Azure Dashboard for your Team.


Select another Dashboard.

Create your Own Dashboard.

Now we have the first VM with CPU percentage in the Azure Dashboard.

Here I have added More Virtual Machines to the Same Metric Chart.

When you have Azure Kubernetes Cluster to monitor :

From here you can Add Container Insights information into your Azure Dashboard :

Adding Azure Monitor Container Insights of KubeCluster01

The Azure Monitor Container Insights logs for your Dashboard information, with Pin to Dashboard.


When you right click with your mouse on the dashboard, you can edit your dashboard with more Azure Resources
from the tile Gallery. Here you can read more about creating your Own Azure Dashboard with Action Rules.

Azure Monitor for containers is a feature designed to monitor the performance of container workloads deployed to either Azure Container Instances or managed Kubernetes clusters hosted on Azure Kubernetes Service (AKS). Monitoring your containers is critical, especially when you’re running a production cluster, at scale, with multiple applications.
Azure Monitor for containers gives you performance visibility by collecting memory and processor metrics from controllers, nodes, and containers that are available in Kubernetes through the Metrics API. Container logs are also collected. After you enable monitoring from Kubernetes clusters, these metrics and logs are automatically collected for you through a containerized version of the Log Analytics agent for Linux and stored in your Log Analytics workspace.


Read here more about Azure Container Insights with Live Logs.

Follow and Join the community on LinkedIn

JOIN Azure DevOps Community 

JOIN Containers in the Cloud Community 

JOIN Azure Monitor and #Security Community 


Leave a comment

Don’t Miss this Awesome #Microsoft BUILD 2019 Event! #Azure #Cloud #MSBuild

Download the Mobile App here

Seattle May 6-8, 2019

Watch live as technology leaders from across industries share the latest breakthroughs and trends, and explore innovative ways to create solutions. After the keynotes, select Microsoft Build sessions will stream live—dive deep into what’s new and what’s next for developer tools and tech.


Watch the livestream here: https://www.microsoft.com/en-us/build

  • Discover and experience new ways to build, modernize, and migrate your applications. Get hands-on experiences with tools like Azure Kubernetes Service (AKS) that can help you dynamically scale your application infrastructure.
  • Quickly and easily build, train, and deploy your machine learning models using Azure Machine Learning, Azure Databricks, and ONNX. Uncover insights from all your content—documents, images, and media—with Azure Search and Cognitive Services.
  • Join Microsoft for hands-on learning to discover how tools like Visual Studio live share can help you collaborate with your peers instantly.
  • Come learn how to build an end-to-end continuous delivery pipeline that is fast and secure with Azure DevOps technologies. Spend less time maintaining your toolset and more time focusing on customer value.
  • Understand how frameworks like Xamarin and .NET can help you reach customers on all platforms. Learn how to use the same languages, APIs, and data structures across all mobile development platforms.
  • Learn how mixed reality helps you bring your work and data to life when you need it, and where you need it. Start building secure, collaborative mixed reality solutions today using intelligent services, best-in-class hardware, and cross-platform tools.
  • Learn to connect your devices to the cloud using flexible IoT solutions that integrate with your existing infrastructure. Collect untapped data and form valuable insights that help you create better customer experiences and generate new streams of revenue.

Book your Microsoft Build 2019 sessions via the BUILD Scheduler

Vision Keynote by CEO Satya Nadella


Windows Insider Program

Azure DevOps

Azure Monitor

Containers

Have a good look which sessions to follow because there are 431 sessions 👍🚀

JOIN Azure DevOps Community

https://www.linkedin.com/groups/12139259/ 

JOIN Containers in the Cloud Community

https://www.linkedin.com/groups/13539967/ 

JOIN Azure Monitor and Security Community https://www.linkedin.com/groups/13517115/ 


Leave a comment

Inside Azure Management (Preview) Free E-Book #Azure #Cloud #Management #MVPBuzz

Inside Azure Management

This Awesome Inside Azure Management E-book is a must have with Great content !

Chapter 1 – Intro
Chapter 2 – Implementing Governance in Azure
Chapter 3 – Migrating Workloads to Azure
Chapter 4 – Configuring Data Sources for Azure Log Analytics
Chapter 5 – Monitoring Applications
Chapter 6 – Monitoring Infrastructure
Chapter 7 – Configuring Alerting and notification
Chapter 8 – Monitor Databases
Chapter 9 – Monitoring Containers
Chapter 10 – Implementing Process Automation
Chapter 11 – Configuration Management
Chapter 12 – Monitoring Security-related Configuration
Chapter 13 – Data Backup for Azure Workloads
Chapter 14 – Implementing a Disaster Recovery Strategy
Chapter 15 – Update Management for VMs
Chapter 16 – Conclusion

It’s all about Azure Management in the Cloud written by Great Microsoft MVP’s.
Download the Free Inside Azure Management E-book here


Follow the Authors here :  Tao Yang, Stanislav Zhelyazkov, Pete Zerger, and Kevin Greene, along with Anders Bengtsson, CSA for Microsoft.

Thank you for all the work guys and Congrats on this Awesome E-Book ! 😉


Leave a comment

#Microsoft Azure Sentinel (Preview) Overview #Azure #Sentinel #Security #Analytics #SIEM


Microsoft Azure Sentinel

Microsoft Azure Sentinel delivers intelligent security analytics and threat intelligence across the enterprise, providing a single solution for alert detection, threat visibility, proactive hunting, and threat response.

  • Collect data at cloud scale across all users, devices, applications, and infrastructure, both on-premises and in multiple clouds.
  • Detect previously undetected threats, and minimize false positives using Microsoft’s analytics and unparalleled threat intelligence.
  • Investigate threats with artificial intelligence, and hunt for suspicious activities at scale, tapping into years of cyber security work at Microsoft.
  • Respond to incidents rapidly with built-in orchestration and automation of common tasks.

In the following step-by-step guide you get a global overview of Azure Sentinel :

Search for Azure Sentinel in the Azure Portal.

Click on Create

Connect or add your Workspace.

Click on Add Azure Sentinel

Azure Sentinel is added to your workspace.

Azure Sentinel Overview

Security Analytics

Learn here more with Microsoft Azure Monitor analytics queries

Here you can play with Azure Log Analytics 😉

Here you can collect all your Security Cases

Azure Sentinel Build-In Dashboard Solutions

Azure AD Audit Logs


Linux Machines Security

When you have your Azure Sentinel Solutions in place with alerting rules and telemetry and analytics is coming to your workspace, Hunting is the next Threat management tool :

Azure sentinel Hunting

Working with Tags and Collaborate with Teammates

Launch Investigations and Bookmark

Working with Azure Notebooks for Azure Sentinel

Welcome to the Azure Sentinel repository! This repository contains out of the box detections, exploration queries, hunting queries, dashboards and playbooks to help you get ramped up with Azure Sentinel and provide you security content to secure your environment and hunt for threats. You can also submit any issues or feature requests as you onboard to Azure Sentinel. For questions and feedback, please contact AzureSentinel@microsoft.com

Azure Sentinel Notebooks on GitHub


Get started from here to Configure your Azure Sentinel Environment

Choose your Data Collections for Azure Sentinel Security

Lot of Choice already Build-in for you.

From here you can make your own Azure Sentinel Analytics Alert Rules.

Alert Rules

Create Alert rules with the right mappings, triggers, and scheduling, response automation.

Add your own playbooks for your Security

Unlock the power of AI for security with Machine Learning

Machine Learning in Azure Sentinel is built-in right from the beginning. We have thoughtfully designed the system with ML innovations aimed to make security analysts, security data scientists and engineers productive. One such innovation is Azure Sentinel Fusion built especially to reduce alert fatigue.

Building your Full Screen Dashboard for Monitoring

More information about Azure Sentinel Intelligent Security :

Start here free with Azure Sentinel Preview

Microsoft azure Sentinel Docs

Microsoft Azure Sentinel on GitHub

Join Microsoft Azure Monitor & Security for Hybrid IT Community


Leave a comment

How to monitor your #Kubernetes clusters – Best Practices Series #AKS #AzureMonitor

Get best practices on how to monitor your Kubernetes clusters from field experts in this episode of the Kubernetes Best Practices Series. In this intermediate level deep dive, you will learn about monitoring and logging in Kubernetes from Dennis Zielke, Technology Solutions Professional in the Global Black Belts Cloud Native Applications team at Microsoft.

Multi-cluster view from Azure Monitor

Azure Monitor provides a multi-cluster view showing the health status of all monitored AKS clusters deployed across resource groups in your subscriptions. It shows AKS clusters discovered that are not monitored by the solution. Immediately you can understand cluster health, and from here you can drill down to the node and controller performance page, or navigate to see performance charts for the cluster. For AKS clusters discovered and identified as unmonitored, you can enable monitoring for that cluster at any time.

Understand AKS cluster performance with Azure Monitor for containers

Container Live Logs provides a real-time view into your Azure Kubernetes Service (AKS) container logs (stdout/stderr) without having to run kubectl commands. When you select this option, new pane appears below the containers performance data table on the Containers view, and it shows live logging generated by the container engine to further assist in troubleshooting issues in real time.
Live logs supports three different methods to control access to the logs:

AKS without Kubernetes RBAC authorization enabled
AKS enabled with Kubernetes RBAC authorization
AKS enabled with Azure Active Directory (AD) SAML based single-sign on

You even can search in the Container Live Logs for Troubleshooting and history.

View Container Live logs with Azure Monitoring for AKS | Kubernetes | Containers