Windows Program Manager, Sandeep Deo, demonstrates the new Update Compliance Service in Windows Analytics. Windows Analytics Update Compliance gives you a unified view of the update and anti-malware status of your Windows 10 devices regardless of your management solution. See how you can use it to keep your devices secure and up to date, track the overall protection and threat status, and monitor your updated deployments and troubleshoot issues as they arise.
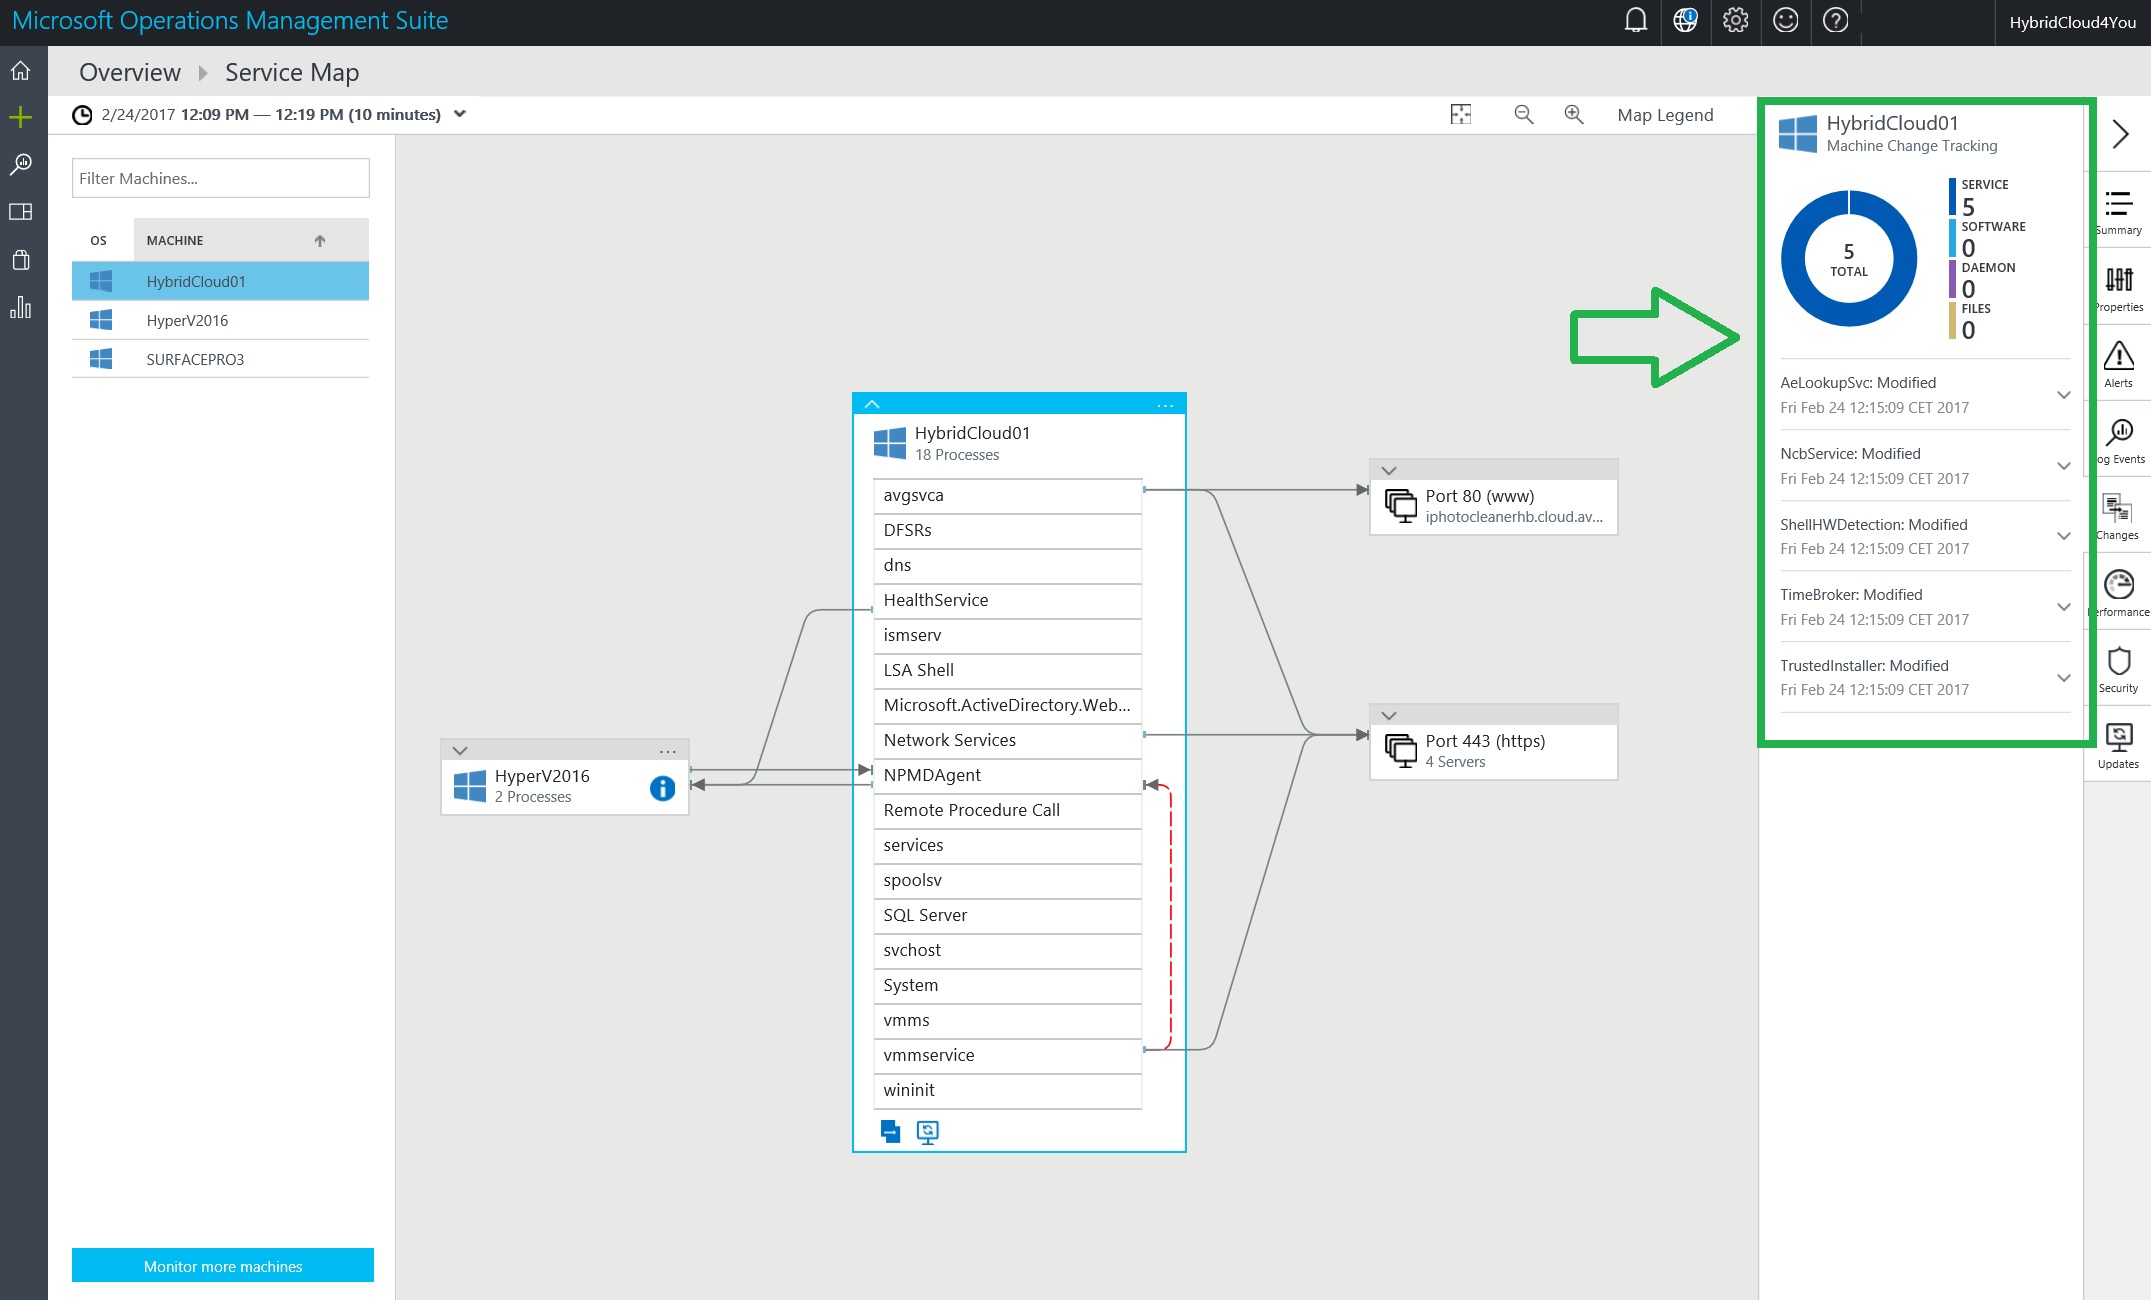
Service Map in #MSOMS automatically builds a common reference map of dependencies across your servers, processes, and third-party services. It discovers and maps all TCP dependencies, identifying surprise connections, remote third-party systems you depend on, and dependencies to traditional dark areas of your network such as Active Directory. Service Map discovers failed network connections that your managed systems are attempting to make, helping you identify potential server misconfiguration, service outages, and network issues.
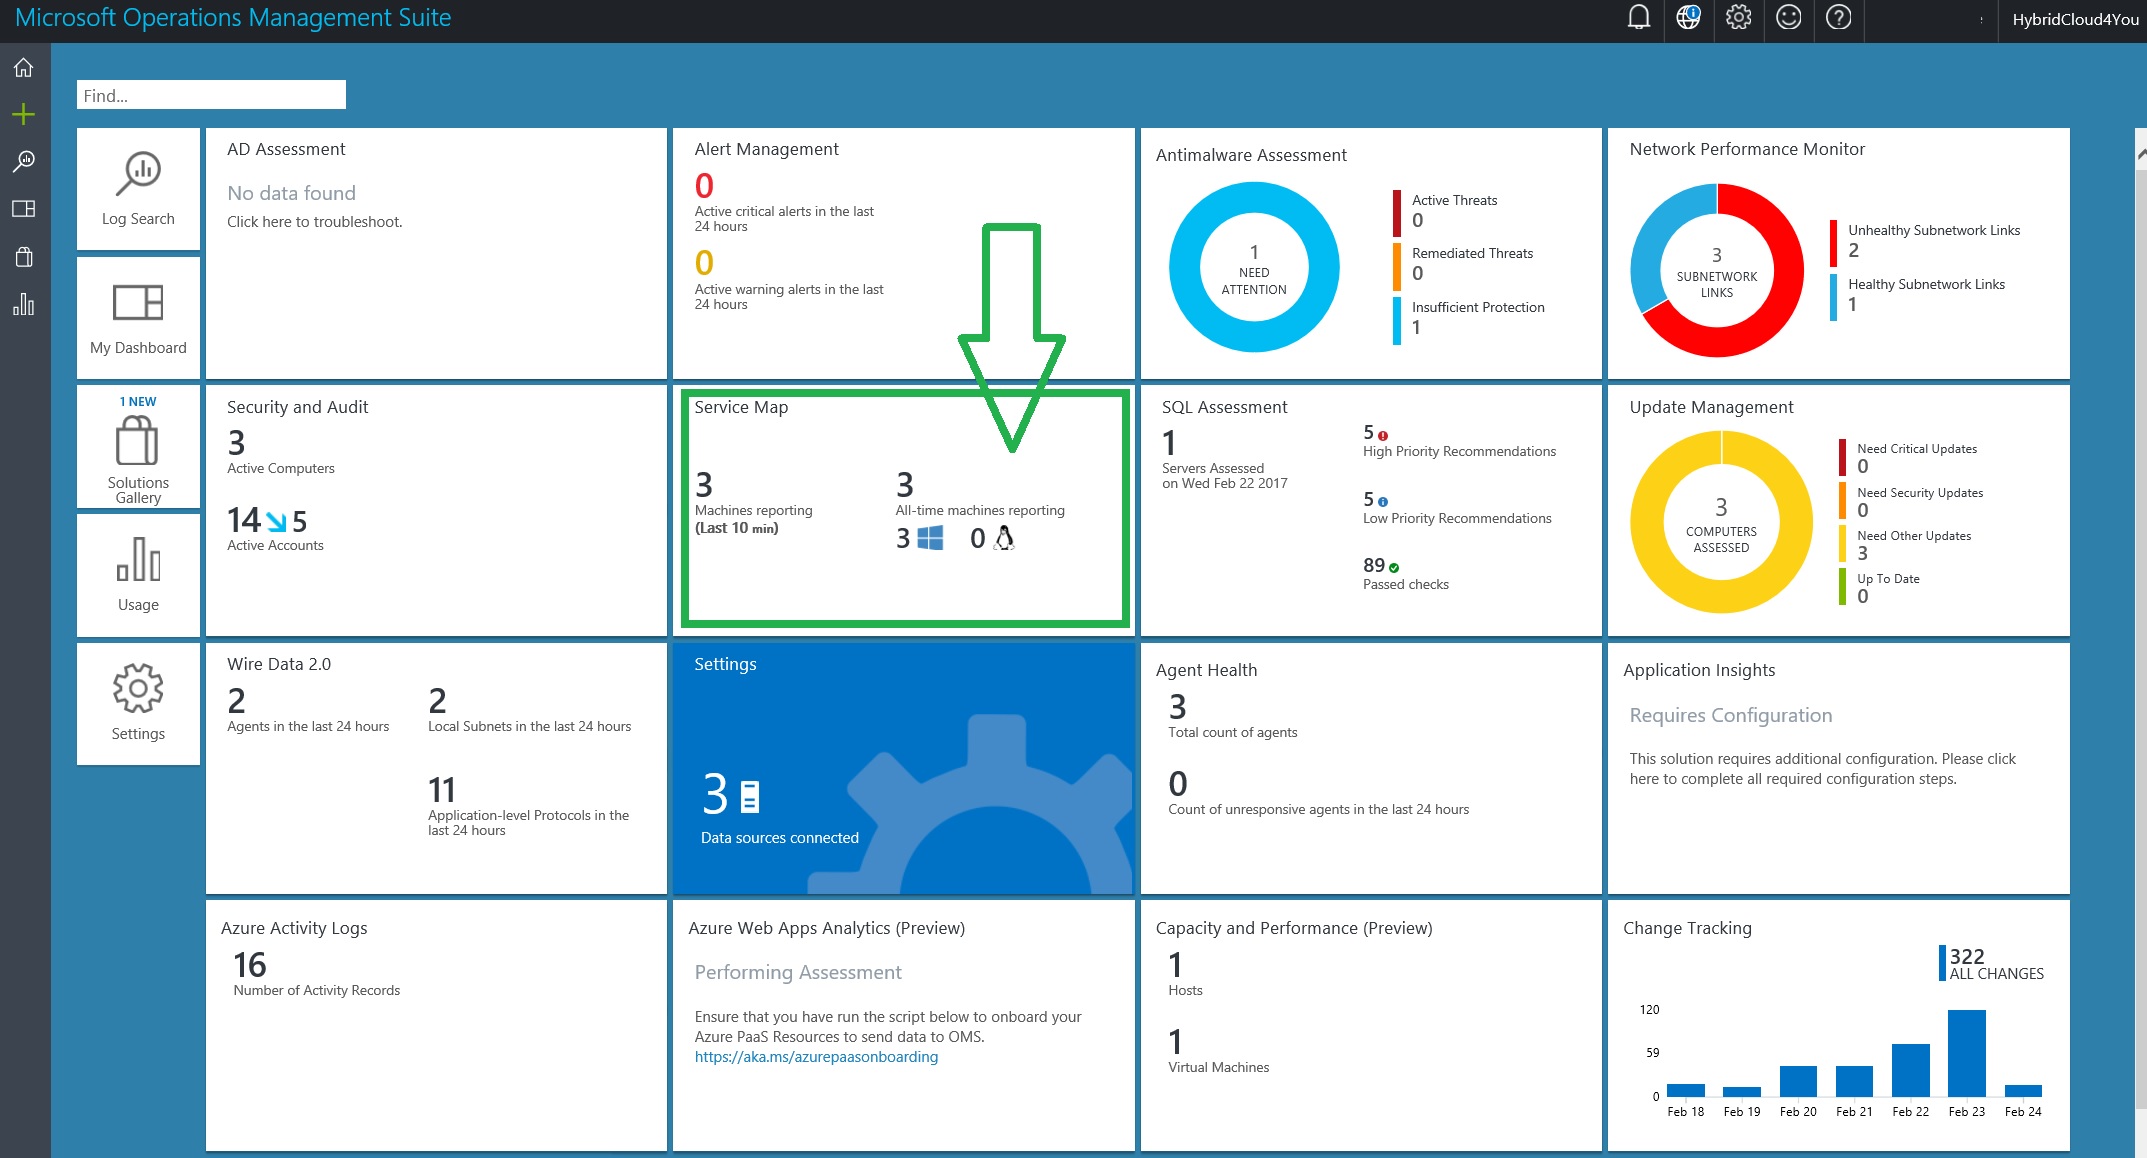
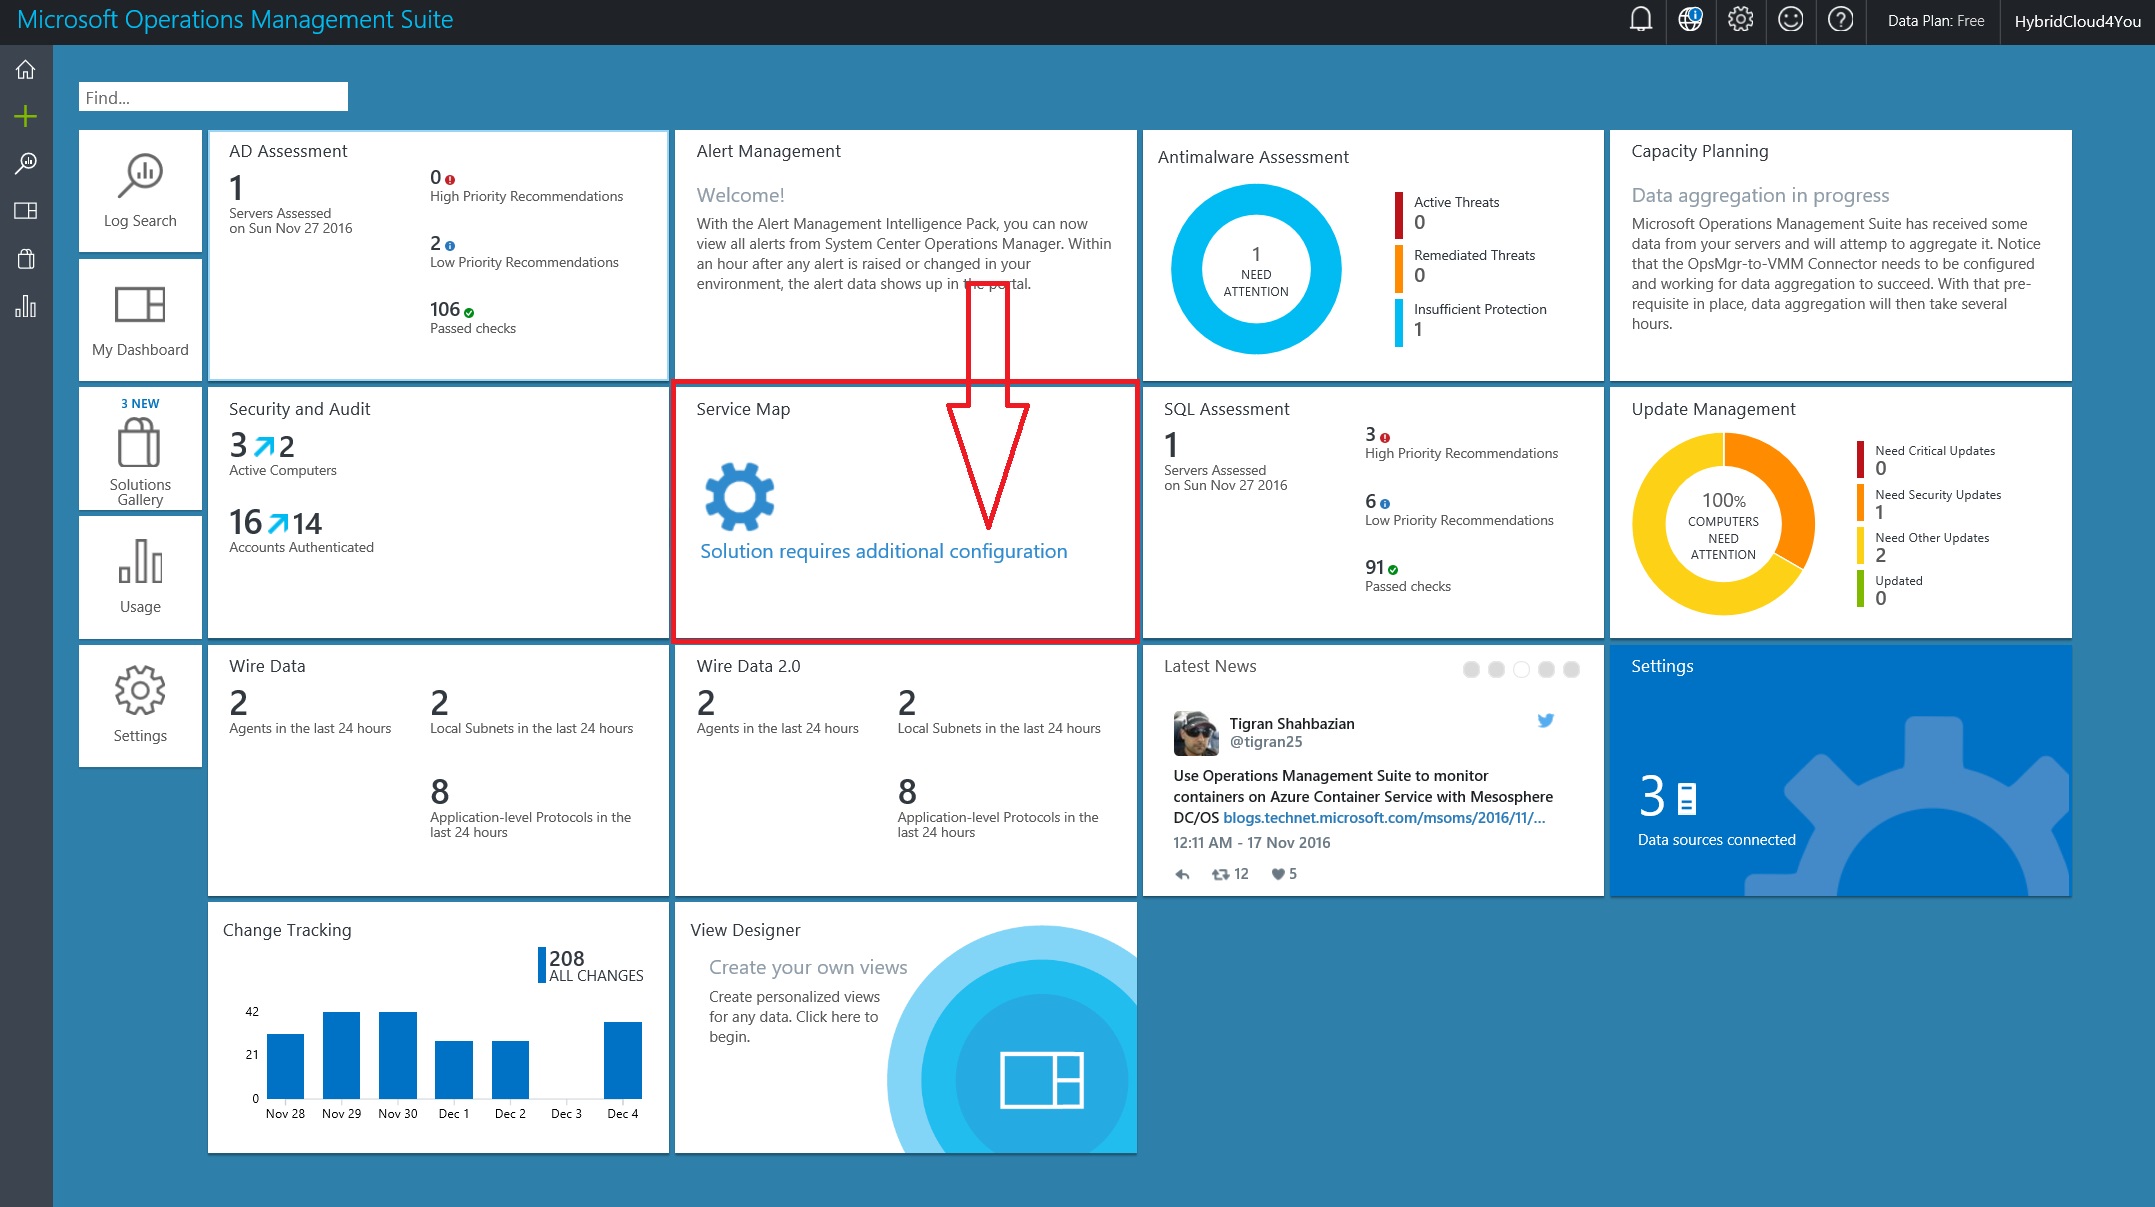
Configuring Service Map solution in Operations Management Suite (OMS)
Service Map gets its data from the Microsoft Dependency Agent. The Dependency Agent is dependent on the OMS Agent for its connections to OMS. This means that a server must have the OMS Agent installed and configured first, and then the Dependency Agent can be installed. The following table describes the connected sources that are supported by the Service Map solution.
I like Microsoft OMS Service Map a lot because you can see the relations between Servers, Services, Applications in a Hybrid IT environment and
get proactive alerts to take action to keep your Hybrid Datacenters Healthy 🙂
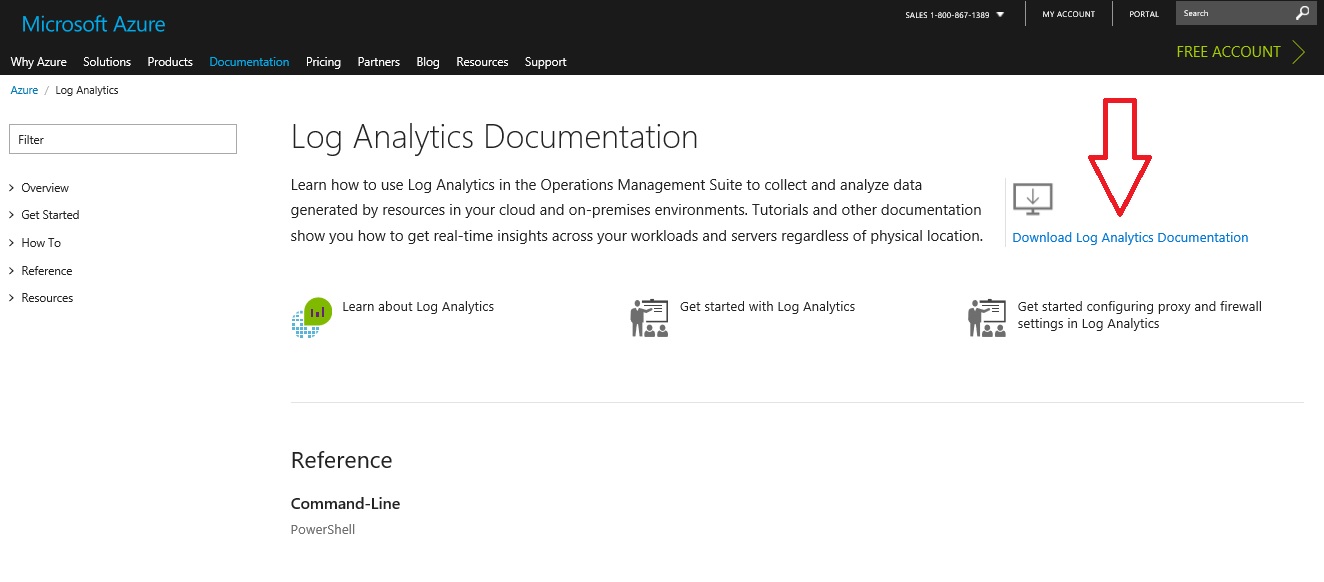
Learn how to use Log Analytics in the Operations Management Suite to collect and analyze data generated by resources in your cloud and on-premises environments. Tutorials and other documentation show you how to get real-time insights across your workloads and servers regardless of physical location
This blogpost describes how to set-up and use the Network Performance Monitor solution in OMS, which helps you monitor the performance of your networks-in near real-time-to detect and locate network performance bottlenecks. With the Network Performance Monitor solution, you can monitor the loss and latency between two networks, subnets or servers. Network Performance Monitor detects network issues like traffic blackholing, routing errors, and issues that conventional network monitoring methods are not able to detect. Network Performance Monitor generates alerts and notifies as and when a threshold is breached for a network link. These thresholds can be learned automatically by the system or you can configure them to use custom alert rules. Network Performance Monitor ensures timely detection of network performance issues and localizes the source of the problem to a particular network segment or device.+
You can detect network issues with the solution dashboard which displays summarized information about your network including recent network health events, unhealthy network links, and subnetwork links that are facing high packet loss and latency. You can drill-down into a network link to view the current health status of subnetwork links as well as node-to-node links. You can also view the historical trend of loss and latency at the network, subnetwork, and node-to-node level. You can detect transient network issues by viewing historical trend charts for packet loss and latency and locate network bottlenecks on a topology map. The interactive topology graph allows you to visualize the hop-by-hop network routes and determine the source of the problem. Like any other solutions, you can use Log Search for various analytics requirements to create custom reports based on the data collected by Network Performance Monitor.+
The solution uses synthetic transactions as a primary mechanism to detect network faults. So, you can use it without regard for a specific network device’s vendor or model. It works across on-premises, cloud (IaaS), and hybrid environments. The solution automatically discovers the network topology and various routes in your network.+
Typical network monitoring products focus on monitoring the network device (routers, switches etc.) health but do not provide insights into the actual quality of network connectivity between two points, which Network Performance Monitor does.
When you have added the Microsoft OMS Network Performance Monitor (Preview) to your Dashboard you have to install OMS agents and configure them in an easy way to start the Network Performance solution and getting results.
Install OMS Agents.
Configure OMS Agents
Create your Networks.
1. Install OMS Agents :
In order to work with OMS, OMS agents are required to be installed on all servers of interest.
NPM requires agents to be installed on at least 2 servers to monitor the connectivity between them. We recommend that for every subnet that you want to monitor, select two or more servers and install the agent on them. If you are unsure about the topology of your network, simply install the agents on critical workloads for which you want to monitor the network performance.
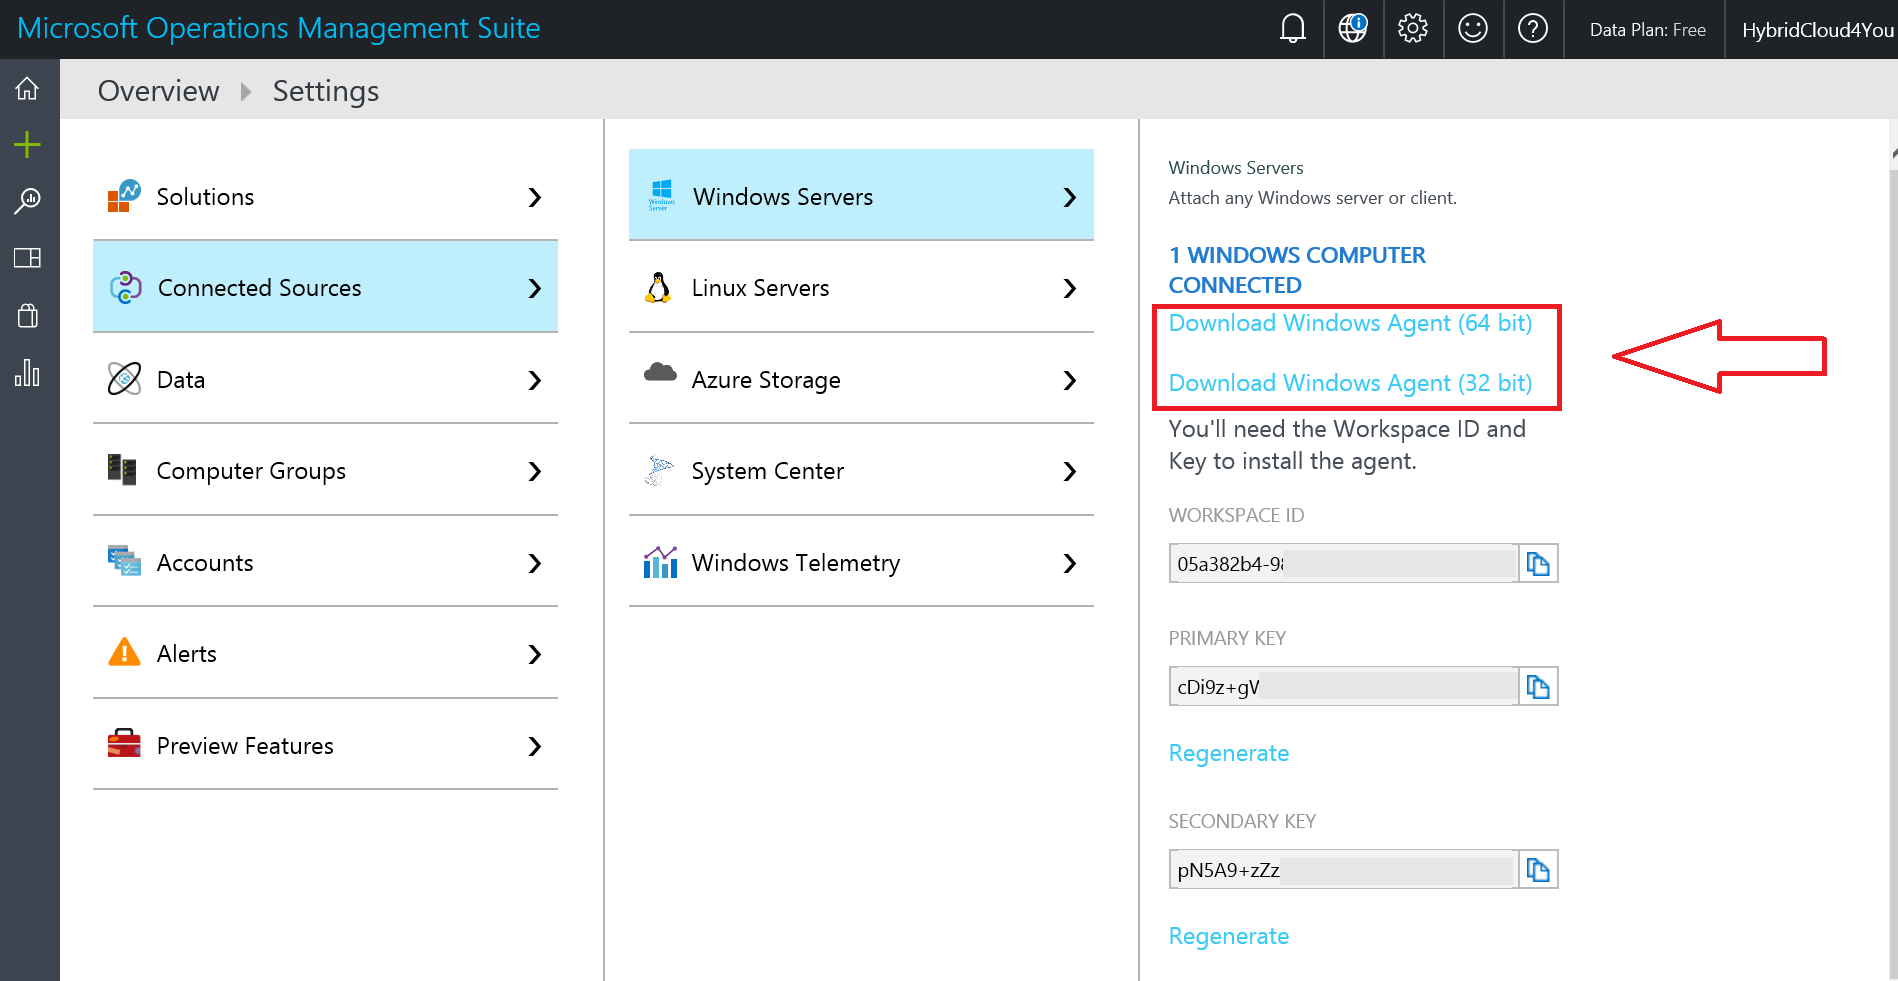
Here you can download your OMS Agent for your Server
If you are deploying using SCOM you should ignore step 1 and jump directly to step 2
Once the NPM solution is enabled on your OMS workspace the required management packs for NPM will automatically flow down to the machines that are connected to OMS via SCOM.
In case you want to connect SCOM with OMS but haven’t figured out how to do it yet, click on the link below. How to Connect SCOM to OMS
2. Configure OMS agents :
Firewall ports are required to be opened on the servers so that the agents can connect to each other.
Run the script without any parameters in a power shell window with administrative privileges. This script creates few registry keys required by NPM and creates windows firewall rules to allow agents to create TCP connections with each other
The port opened by default would be 8084. You have the option of using a custom port by providing the parameter ‘portNumber’ to the script. However, the same port should be used on all the machines where the script is executed.
Note that the script will configure only windows firewall locally. If you have a network firewall you should make sure that it is allowing traffic destined for the TCP port being used by NPM
Run the Powershell script as Administrator on your Servers.
3. Create your Networks :
A ‘Network’ in NPM is a container for a bunch of subnets. The Default network is the container for all the subnets that are not contained in any user defined network. In the most likely case the subnets in your organization will be arranged in more than one network and you should create one or more network to logically group your subnets.
You can create network with any name that meets your business requirements and add the subnets to the network.
Once you have saved the configuration for the first time, the solution will start collecting network data. The process usually takes a while. Once the data has been uploaded you should be able to see the solution dashboard with data and graphs. At this point the setup is complete and you can start using the solution
The OMS Performance Monitor Solution needs time to get the information of your network.
I have only one network in my lab environment
OMS Network Performance Monitor (Preview)
The issue here is that my switches are not IP V6 ready 😦
After a view days analytics you can make your own custom view
Here you can plot network performance issues between two Servers
Everything is fine here 🙂
When something is wrong you can go directly to the View Node Logs.
OMS Log analytics results of your Server
When you have a large network with a lot of HOPS like switches and routers you can see where you have latency :
The OMS NPM solution is still in preview but you can test it in your test environment to learn and get a better network by eliminating your network issues.
When you use the OMS Gateway on-premises you can connect your Servers to Operations Management Suite, here you
find my blogpost for the installation and configuration :
Service Map automatically discovers application components on Windows and Linux systems and maps the communication between services. It allows you to view your servers as you think of them – as interconnected systems that deliver critical services. Service Map shows connections between servers, processes, and ports across any TCP-connected architecture with no configuration required other than installation of an agent.
Instead of each individual agent sending data directly to OMS and requiring a direct Internet connection, all agent data is instead sent through a single computer that has an Internet connection. That computer is where you install and use the gateway. In this scenario, you can install agents on any computers where you want to collect data. The gateway then transfers data from the agents to OMS directly.
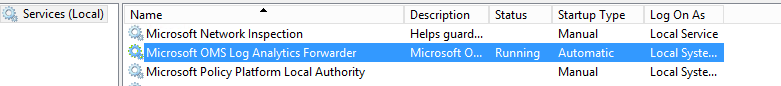
Now the Microsoft OMS Gateway Services is installed
Now Microsoft Operations Management Suite Gateway is installed, you can use some Microsoft Powershell Commands :
After the installation of the OMS Gateway, I installed the OMS Agent :
Download your OMS Agent here
Copy => Paste your OMS Workspace ID and Key.
Here you can see the OMS Agent Connection settings.
When you wait for a few minutes you will see the connection in the Portal of OMS.
After this I installed the OMS Agent on One of my Domain Controllers with OMS Gateway settings //HyperV2016.hybridcloud4you.nl:8080.
This is what you will see in the Event Viewer of the OMS Gateway Server :
Domain Controller 192.168.2.100 is going via the OMS Gateway
OMS Agent via the Microsoft OMS Gateway
From here you can start with your OMS Solutions 😉
It is also possible to connect your System Center Operations Manager (SCOM) on-premises to the OMS Gateway.
Then you don’t have to connect your SCOM Management Server directly to the internet to OMS.
The OMS Log Analytics Forwarder enables customers to have their OMS managed devices (Windows and Linux) to send data to a central server which has access to the internet. OMS Log Analytics Forwarder is a HTTP forward proxy that support HTTP tunneling via HTTP CONNECT command. The Forwarder can handle up to 1000 OMS concurrent connected devices if run on a 4 core CPU, 8GB Windows Server with a 1Gbps network connection. In order to use the OMS Log Analytics Forwarder, you need to install the OMS agent on the Forwarder Server.
Microsoft Operations Management Suite (OMS) Dashboard Online
Lot of Enterprise Organizations do New Microsoft Projects on-premises in Datacenters installed by the IT Department or by external third party with a
Microsoft SQL instance solution configured. Before your New project is going into production for your customers, It’s very good to do a
Microsoft Operations Management Suite (OMS) SQL Assessment to see if your SQL Solution is installed and Configured well.
If you don’t have a Microsoft Operations Management Suite Plan, you can get one here
When you Login to OMS, you have to add the SQL Assessment Solution
When the SQL Assessment Solution is activated, It can take a while because the assessment has to collect data of the SQL settings.
When It’s finished collecting data you will see this on your MSOMS Dashboard :
Click on the SQL Assessment here
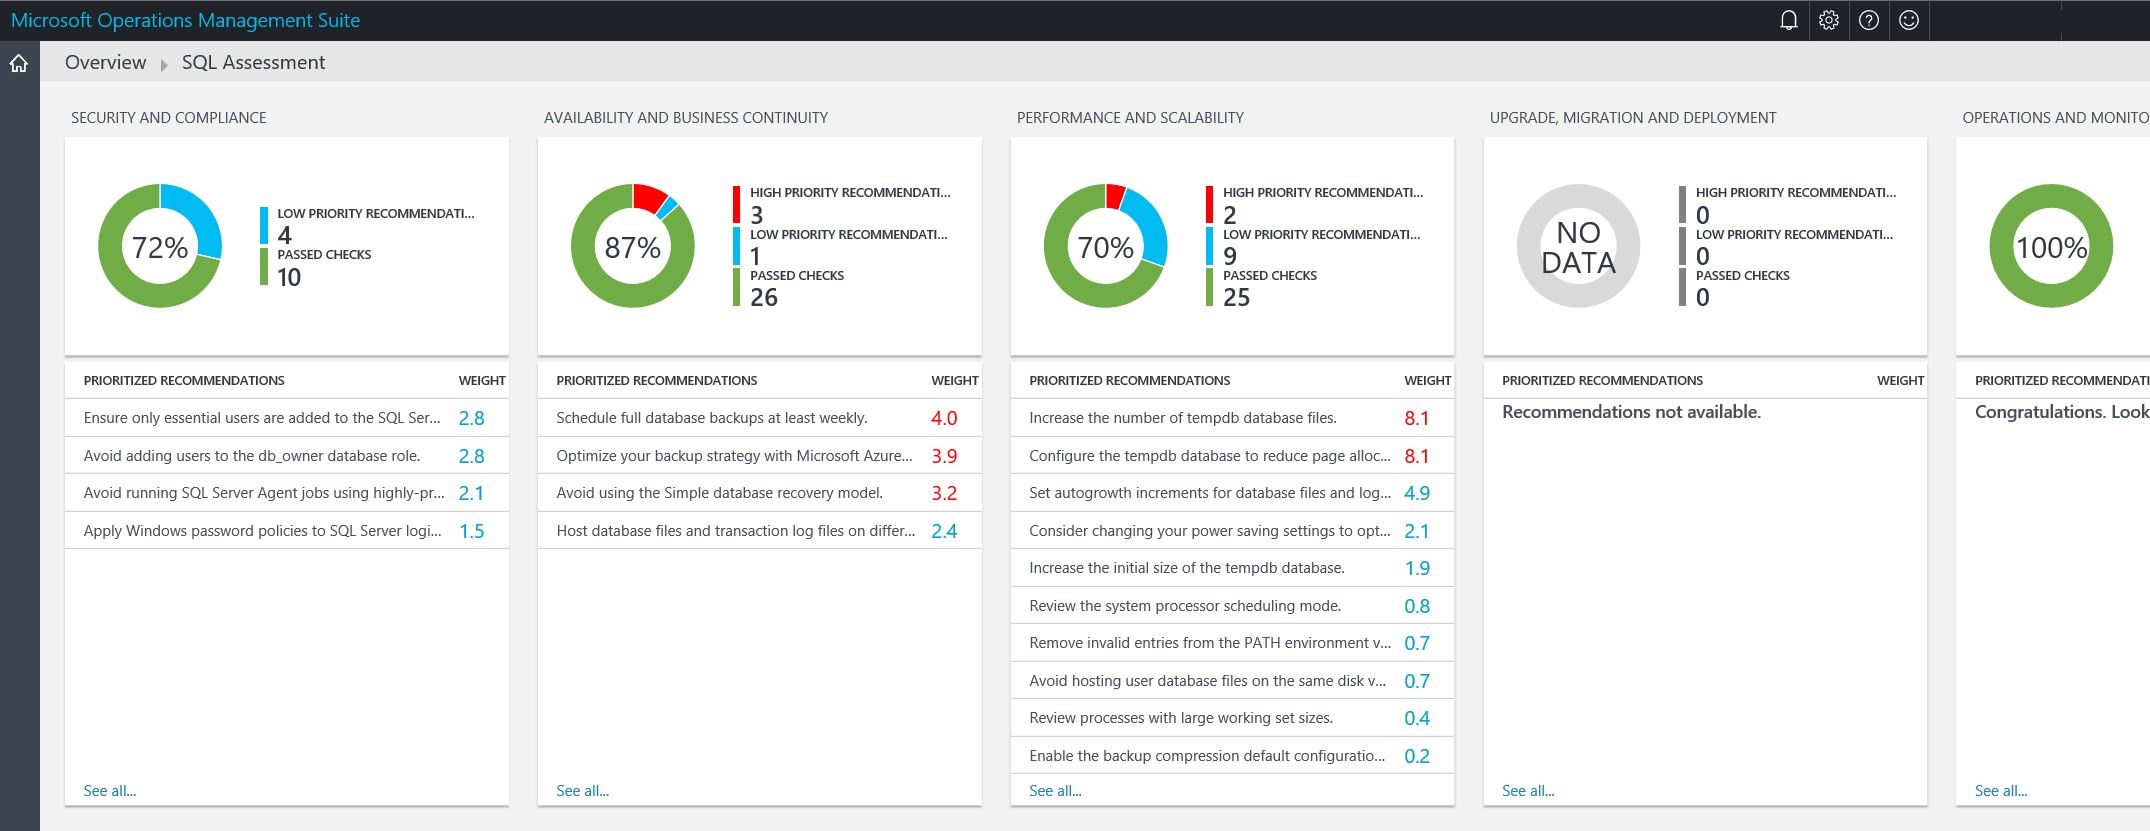
Here you see the SQL Assessment Dashboard
It does SQL Assessments on the following topics :
Security and Compliance
Availability and Business Continuity
Performance and Scalability
Upgrade, Migration and Deployment
Operations and Monitoring
Change and Configuration Management
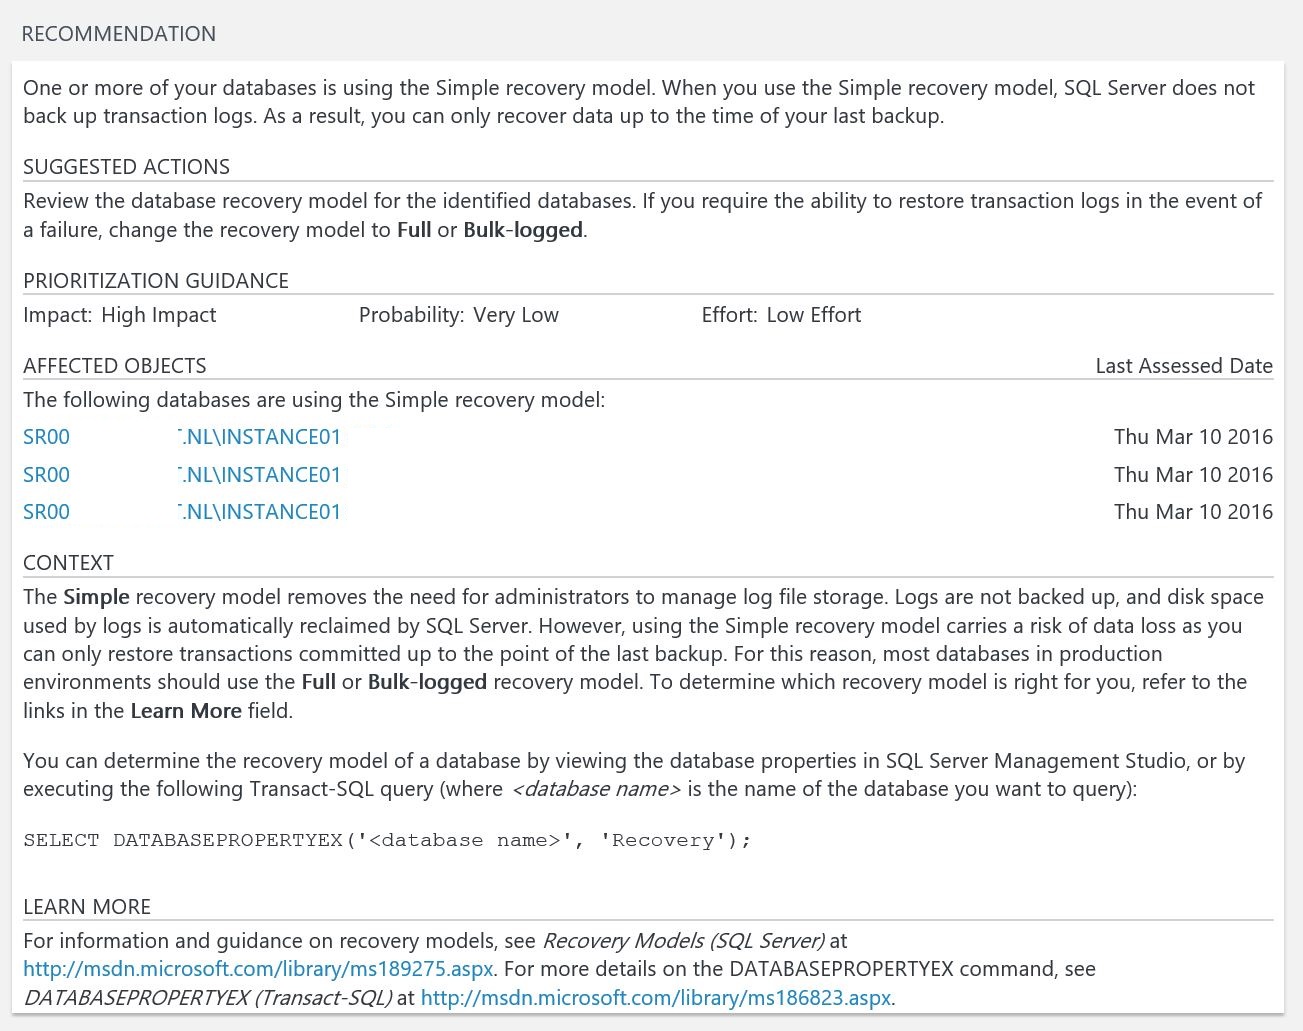
Here you see Microsoft Best Practices Advice for your SQL environment, but It’s also helping you to get the job done if configuration is needed
like in this example :
So Before your New Project goes into Production state for your Customers, It’s important to get fully in Control of the best practices with #MSOMS on
your Solution.
At the core of Microsoft OMS is the log search feature which allows you to combine and correlate any machine data from multiple sources within your environment. Solutions are also powered by log search to bring you metrics pivoted around a particular problem area.
On the Search page, you can create a query, and then when you search, you can filter the results by using facet controls. You can also create advanced queries to transform, filter, and report on your results.
Common log search queries appear on most solution pages. Throughout the OMS console, you can click tiles or drill in to other items to view details about the item by using log search.In this tutorial, we’ll walk through examples to cover all the basics when you use log search.
We’ll start with simple, practical examples and then build on them so that you can get an understanding of practical use cases about how to use the syntax to extract the insights you want from the data.
When you conduct log searches in OMS, you’ll use the following techniques: