OMS Network Performance Monitor (Preview)
This blogpost describes how to set-up and use the Network Performance Monitor solution in OMS, which helps you monitor the performance of your networks-in near real-time-to detect and locate network performance bottlenecks. With the Network Performance Monitor solution, you can monitor the loss and latency between two networks, subnets or servers. Network Performance Monitor detects network issues like traffic blackholing, routing errors, and issues that conventional network monitoring methods are not able to detect. Network Performance Monitor generates alerts and notifies as and when a threshold is breached for a network link. These thresholds can be learned automatically by the system or you can configure them to use custom alert rules. Network Performance Monitor ensures timely detection of network performance issues and localizes the source of the problem to a particular network segment or device.+
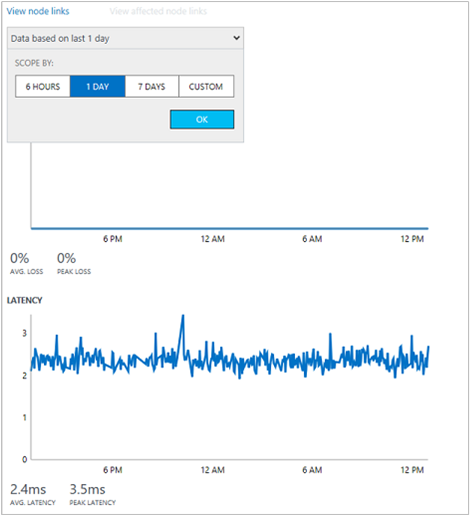
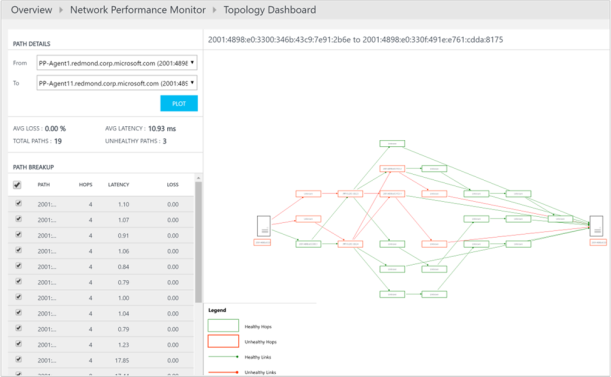
You can detect network issues with the solution dashboard which displays summarized information about your network including recent network health events, unhealthy network links, and subnetwork links that are facing high packet loss and latency. You can drill-down into a network link to view the current health status of subnetwork links as well as node-to-node links. You can also view the historical trend of loss and latency at the network, subnetwork, and node-to-node level. You can detect transient network issues by viewing historical trend charts for packet loss and latency and locate network bottlenecks on a topology map. The interactive topology graph allows you to visualize the hop-by-hop network routes and determine the source of the problem. Like any other solutions, you can use Log Search for various analytics requirements to create custom reports based on the data collected by Network Performance Monitor.+
The solution uses synthetic transactions as a primary mechanism to detect network faults. So, you can use it without regard for a specific network device’s vendor or model. It works across on-premises, cloud (IaaS), and hybrid environments. The solution automatically discovers the network topology and various routes in your network.+
Typical network monitoring products focus on monitoring the network device (routers, switches etc.) health but do not provide insights into the actual quality of network connectivity between two points, which Network Performance Monitor does.
If you are new with Microsoft Operations Management Suite, you can download here a Free OMS Subscription Plan to try it your Self
When you have added the Microsoft OMS Network Performance Monitor (Preview) to your Dashboard you have to install OMS agents and configure them in an easy way to start the Network Performance solution and getting results.
- Install OMS Agents.
- Configure OMS Agents
- Create your Networks.
1. Install OMS Agents :
In order to work with OMS, OMS agents are required to be installed on all servers of interest.
NPM requires agents to be installed on at least 2 servers to monitor the connectivity between them. We recommend that for every subnet that you want to monitor, select two or more servers and install the agent on them. If you are unsure about the topology of your network, simply install the agents on critical workloads for which you want to monitor the network performance.
Here you can download your OMS Agent for your Server
If you are deploying using SCOM you should ignore step 1 and jump directly to step 2
Once the NPM solution is enabled on your OMS workspace the required management packs for NPM will automatically flow down to the machines that are connected to OMS via SCOM.
In case you want to connect SCOM with OMS but haven’t figured out how to do it yet, click on the link below.
 How to Connect SCOM to OMS
2. Configure OMS agents :
Firewall ports are required to be opened on the servers so that the agents can connect to each other.
Run the script without any parameters in a power shell window with administrative privileges. This script creates few registry keys required by NPM and creates windows firewall rules to allow agents to create TCP connections with each other
The port opened by default would be 8084. You have the option of using a custom port by providing the parameter ‘portNumber’ to the script. However, the same port should be used on all the machines where the script is executed.
Note that the script will configure only windows firewall locally. If you have a network firewall you should make sure that it is allowing traffic destined for the TCP port being used by NPM
Run the Powershell script as Administrator on your Servers.
3. Create your Networks :
A ‘Network’ in NPM is a container for a bunch of subnets. The Default network is the container for all the subnets that are not contained in any user defined network. In the most likely case the subnets in your organization will be arranged in more than one network and you should create one or more network to logically group your subnets.
You can create network with any name that meets your business requirements and add the subnets to the network.
Once you have saved the configuration for the first time, the solution will start collecting network data. The process usually takes a while. Once the data has been uploaded you should be able to see the solution dashboard with data and graphs. At this point the setup is complete and you can start using the solution
The OMS Performance Monitor Solution needs time to get the information of your network.
I have only one network in my lab environment
OMS Network Performance Monitor (Preview)
The issue here is that my switches are not IP V6 ready 😦
After a view days analytics you can make your own custom view
Here you can plot network performance issues between two Servers
Everything is fine here 🙂
When something is wrong you can go directly to the View Node Logs.
OMS Log analytics results of your Server
When you have a large network with a lot of HOPS like switches and routers you can see where you have latency :
The OMS NPM solution is still in preview but you can test it in your test environment to learn and get a better network by eliminating your network issues.
When you use the OMS Gateway on-premises you can connect your Servers to Operations Management Suite, here you
find my blogpost for the installation and configuration :
Hybrid IT Connect computers and devices to #MSOMS using the OMS Gateway
Hope this blogpost is useful for you to get your network in Control with Hybrid IT Management of OMS Services.


